This post is a part of a series on drug shortages.
Today I went down a rabbit hole of trying to understand how many of the available drugs in an ATC code are impacted by shortages over time. I used the DPD to get a list of DINs on the market at any given time, and then cross-referenced that list with the DSC drug shortage reports.
Here, for example, is a plot showing the availability of Candesartan over time: the solid line shows how many Candesartan drugs are available at each time point, and the dotted line shows you the effective number of drugs available given the known shortages:

From this chart you can see our options for Candesartan seem to be being whittled away by shortages over the recent months, with no new marketed versions coming on line.
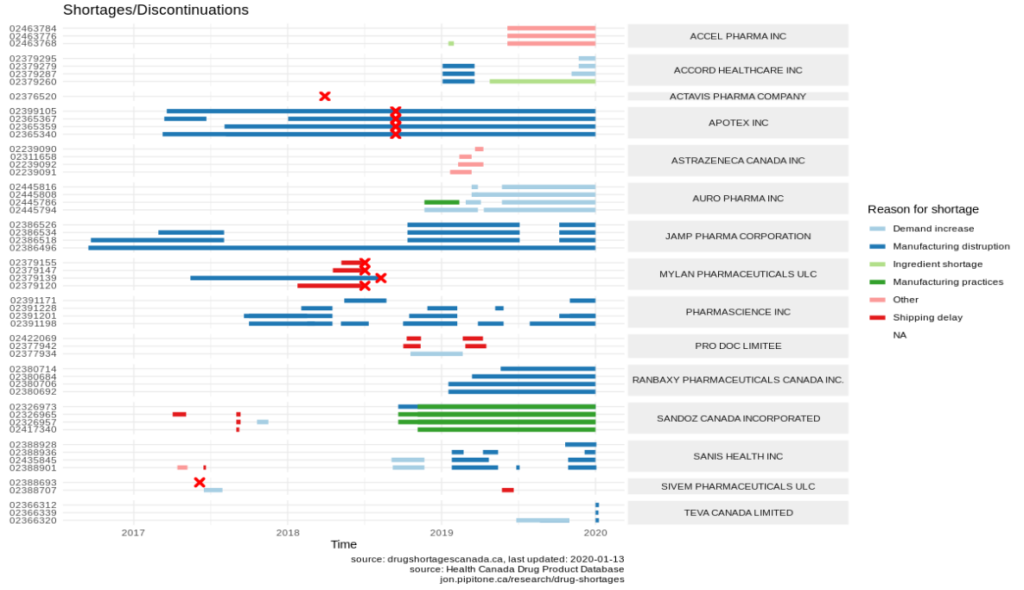
This next chart is more than a little confusing, but this is my attempt at visualizing all of the shortage and discontinuation reports on a time line. Best to just squint at it. DINs are down the Y-axis, time on the x-axis, and shortages represented as coloured bands on the timeline. Discontinuations occur at the big red X’s.

If you notice, there are some drugs that have shortages preceding discontinuations (e.g. all of those by MYLAN mid 2018). Annoyingly, some of drugs have discontinuations occurring during an existing shortages (e.g. APOTEX). My guess is that this is simply because the shortage reports that weren’t properly updated to include an end date once the drug was discontinued.
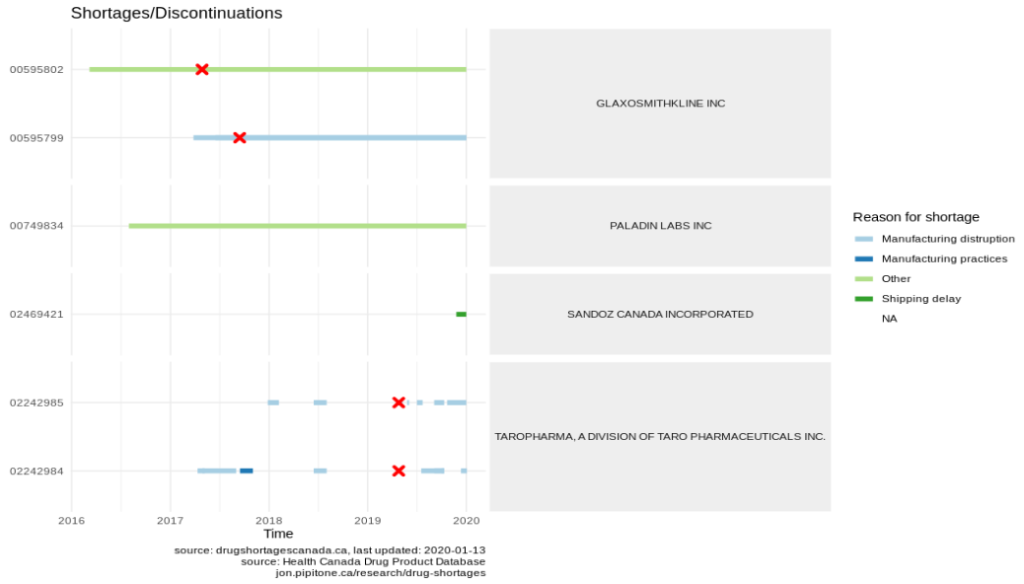
It gets worse though. Here’s topical hydrocortisone (another of the drugs on the EML):

Note the shortages from TAROPHARMA. The drugs appear to have been discontinued early-mid 2019 but continue to have shortage reports filed against them. Does that mean that the reports were made against the wrong DIN?
These errant reports can really mess with tallies. Hydrocortisone cream’s availability when charted (as described above) looks like this:

Note the negative availability? That’s because there are shortage reports for drugs that aren’t on the market according to the DPD. Yikes.
All of this makes me suspicious of the integrity of the DSC data. As I’ve already reported, the ATC codes are often truncated, and now I’m now not sure I even trust the DINs or event dates entirely.
Is it possible to measure how good the DSC data is? A few thoughts:
- Count up the number of times a DIN has these impossible reports (e.g. shortages after a discontinuation, overlapping shortages of the same DIN, end dates before start dates, etc).
- Compare the discontinuation reports from the DSC with the status in the DPD (I assume any discontinued drug in the DSC should be marked as CANCELLED (POST-MARKET) in the DPD. A simple count of mismatches between the DSC and the DPD (which we could consider authoritative as it’s run by Health Canada) would be informative.
- Check the data hygiene: do fields contain what we expect them to contain and how often? E.g. ATC codes filled out correctly, start dates present, etc.